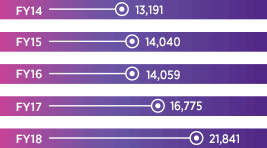
Revenues (₹ Million)
FY13-18 CAGR +12.6%

ZEEL’s revenue has grown at a CAGR of 12.6% over the past five years. However, excluding the Sports business which was divested in FY17, revenue has witnessed 15.9% CAGR over FY13–18. This growth has been primarily driven by the improvement in television network’s viewership share and digitisation of the analogue subscriber base. During FY18, company’s 17.9% growth in advertising revenue adjusted for sale of Sports business was ahead of the industry average. ZEEL’s domestic subscription revenue, adjusted for sale of Sports business, registered a growth of 11.8% YoY.
EBITDA (₹ Million)
FY13-18 CAGR +16.8%

ZEEL’ s EBITDA CAGR of 16.8 % over the last five years has exceeded the revenue growth.EBITDA margins improved from 25.8 % in FY13, to 31.1 % in FY18.This improvement in margins is driven by operating leverage. EBITDA margins(ex - Sports) declined by 200 bps in FY18 due to investments in existing and new businesses.
PBT Before Exceptional Items (₹ Million)
FY13-18 CAGR +15.7%

ZEEL’ s profit before tax has grown at a CAGR of 16 % over the last five years, led by a robust revenue growth and improving margins.During FY18, PBT(before exceptional items) increased by 30.2 % due to higher margins aided by sale of Sports business, lower fair value adjustments and higher other income.
Return on Capital
Employed (%)
FY18 (YoY) -244bps

ZEEL's return on capital employed(ROCE) declined by 244 bps YoY, to 21.1 % in FY18.While EBIT margins(excluding fair value adjustments) remained stable at 28.3 % (28.2 % in FY17), exceptional gain on account of sale of Sports business and lower fair value adjustments led to a higher average net worth.
Networth (₹ Million)
FY18 (YoY) +13.0%

In FY18, ZEEL’s net worth increased by 13%. Besides profit from operations, gains from the sale of the Sports business contributed to this increase.
Television Network Share(%)
FY18 (YoY) +200bps

16.0
FY17

18.0
FY18
ZEEL was the #1 non-sports entertainment television network during the year, with an all-India viewership share of 18.0%. Strong performance of the regional and Hindi GEC portfolio, along with the addition of RBNL channels, contributed to this improvement in viewership share in FY18.
International Reach (Million)
FY18 (YoY) +59.2%

363
FY17

578
FY18
The reach of ZEEL’s international channels increased by 59%, to 578 million people across 170+ countries. Newer distribution partnerships and inclusion of some of the channels in the base pack in a few markets helped increase the reach.
Movie Business
Revenue (₹ Million)
FY18 (YoY) +2.7%

1615
FY17

1660
FY18
Zee Studios released nine movies across three languages during the year. While the movies were well received at the box office, the movies could not replicate the success of last year, when two movies garnered a domestic box office collection of over ₹ 1 billion.
Revenue Breakdown
FY18 Revenue: ₹ 66,857 million
-
63%Advertising revenues
-
30%Subscription revenues
-
7%Other Sales and Services
Distribution of Expenses
FY18 Total Expenses: ₹ 46,096 million
-
55%Operating Costs
-
14%Employee Benefit Expenses
-
31%Other Costs
